Global Atmospheric Carbon dioxide compared to annual emissions (1751-2022)
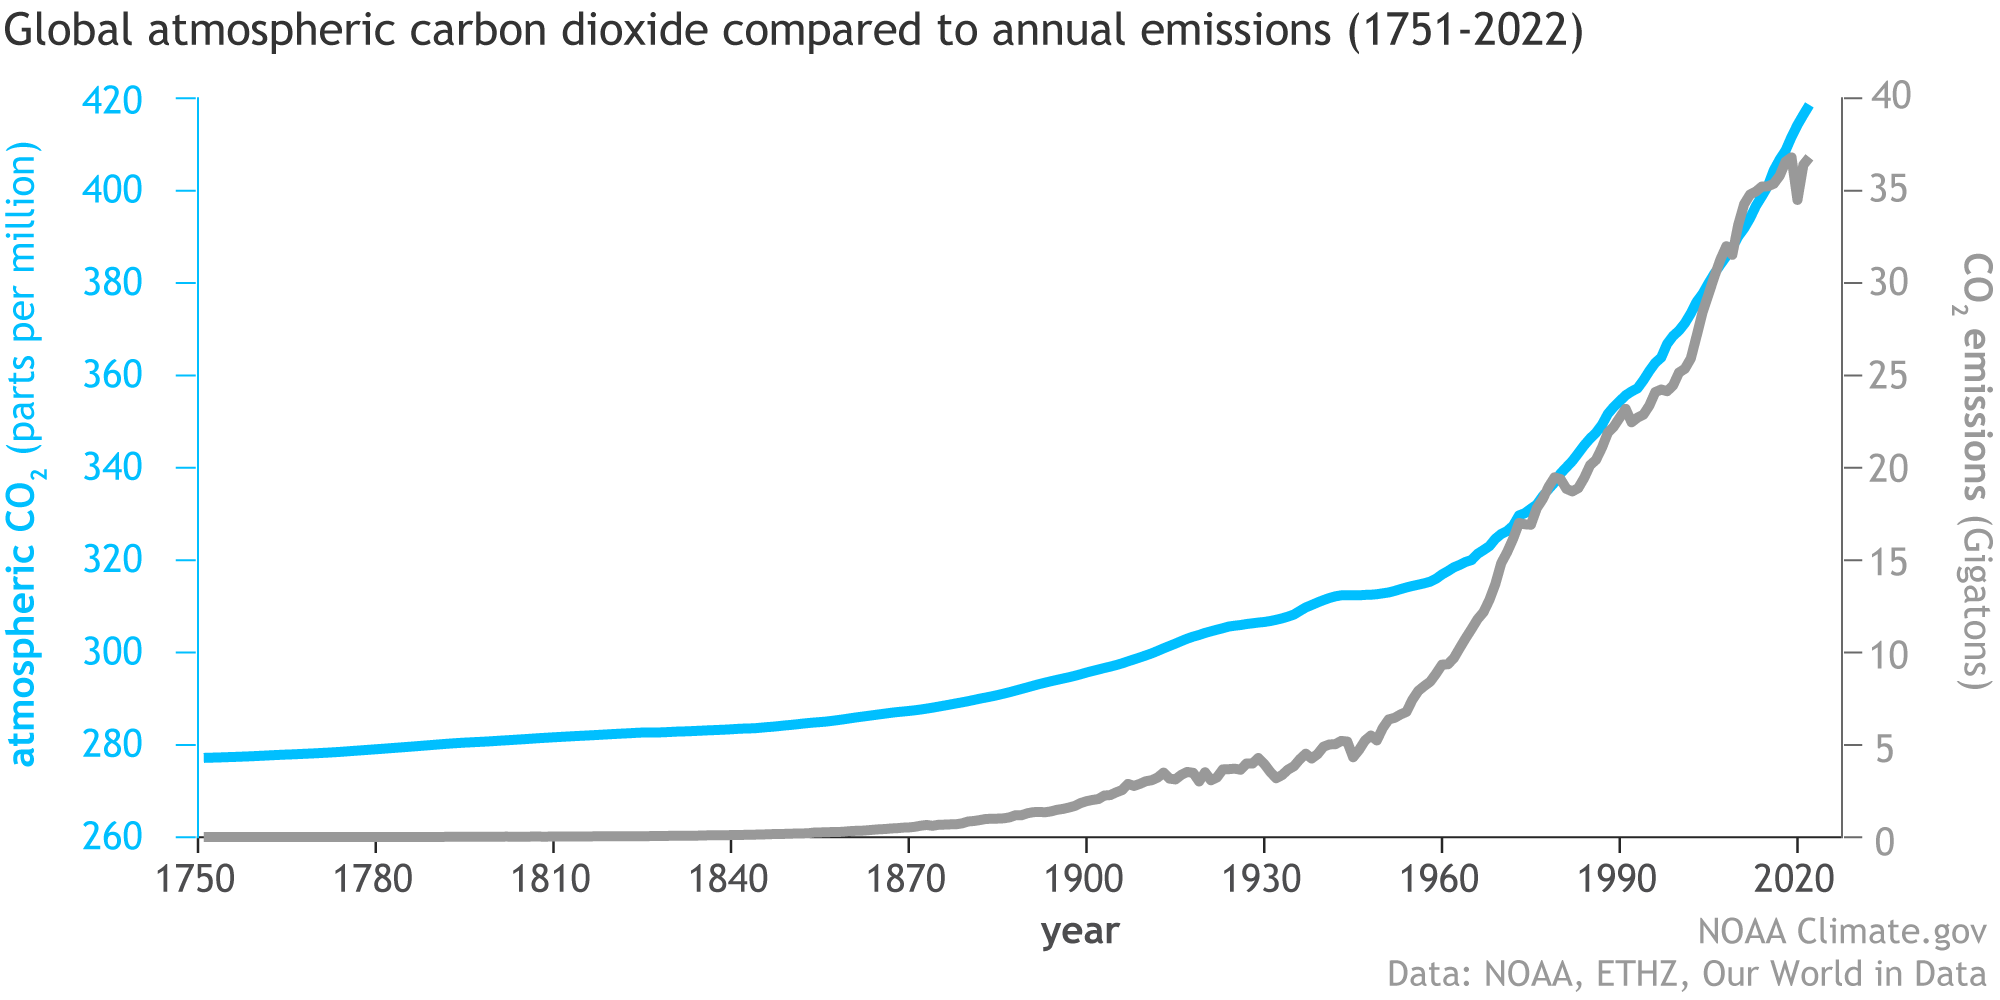

The amount of carbon dioxide in the atmosphere (blue line) has increased along with human emissions (gray line) since the start of the Industrial Revolution in 1750. Emissions rose slowly to about 5 billion tons per year in the mid-20th century before skyrocketing to more than 35 billion tons per year by the end of the century. NOAA Climate.gov graph, adapted from the original by Dr. Howard Diamond (NOAA ARL). Atmospheric CO2 data from NOAA and ETHZ. CO2 emissions data from Our World in Data and the Global Carbon Project.
- Published on : 12th May, 2023
- Published by: NOA & ETHZ
- Source website: https://www.climate.gov/
- Author(s): REBECCA LINDSEY Download option
Was this post helpful?
Let us know if you liked the post. That’s the only way we can improve.